Visualisations
Quick Percent of Previous
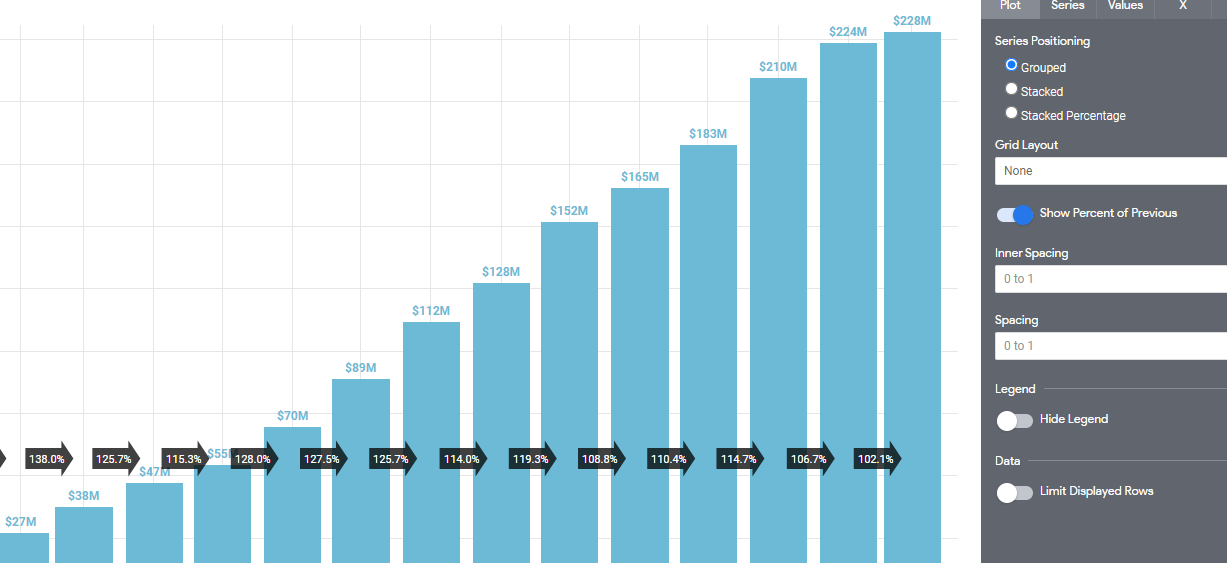
If you want to quickly know the % of previous bar, you can enable this setting in visualisation settings Show Percent of PreviousIt will create arrows overlaying bar chart. Just remember it's the % of the previous bar, not the difference
Put it in a bin or a bucket
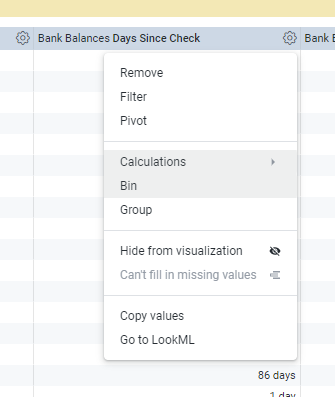
Select your dimension - run your query
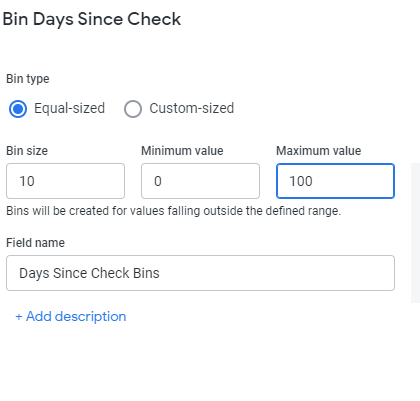
Select the bin size (it's only for regularly sized bins), minimum and maximum value
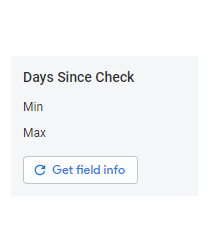
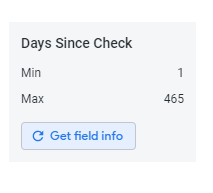
Click
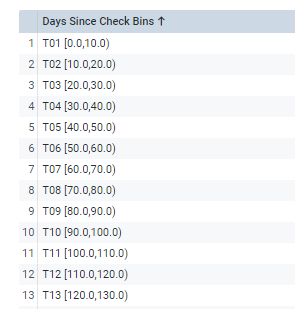
Get Field Infoif you want to see the MIN and MAX values for your dimension. Click SaveNew dimension will show up in your data table
Re-run your query and enjoy your aggregated data by bins.
Row Totals excluded from Conditional Formatting
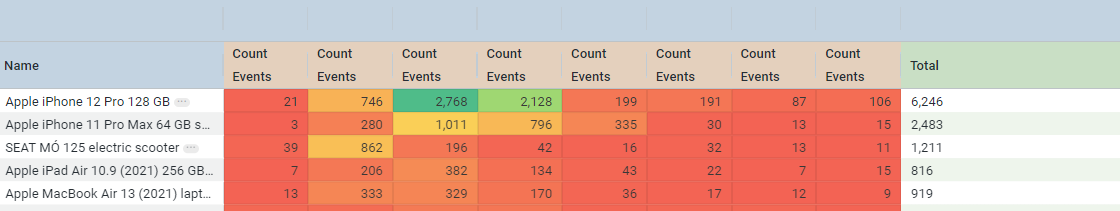
Good ole' Excel got us accustomed to conditional formatting rpetty badly. In Looker, you can also use them when visualising a table. Just go to Settings --> Formatting --> Enable Conditional Formatting.
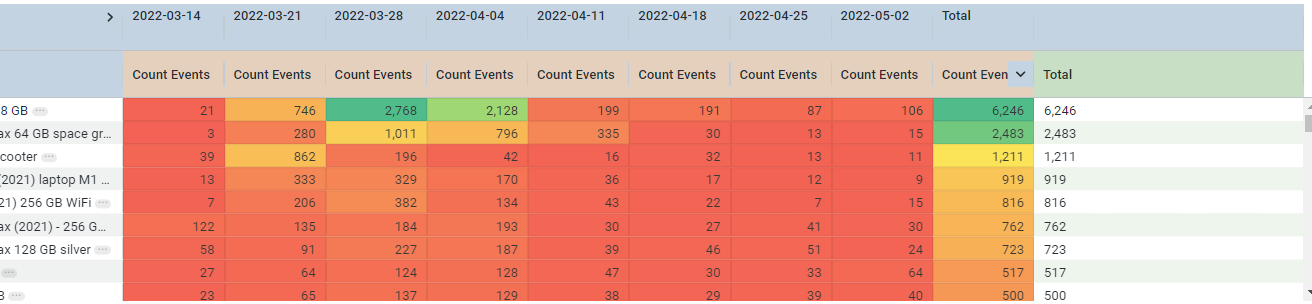
One downside is if you select to show Row Totals in your Data Table, they will be taken into account for conditional formatting - it won't change the scale though but it will be visualised according to the sale of the raw data. In order to bypass this, create a table calculation that has the same result: sum(pivot_row(${your_measure})) and it will be excluded from conditional formatting.
As you can see, the Row Total is formatted but it doesn't change the scale. the highest point 2768 is still green. This becomes more of a visual preference that some people treat as a bug because it's all about visuals with conditional formatting.
Transposing List of Measures
Imagine you only have a list of measures, it could be some financial metrics, average times or counts (but not for funnel) and you would like to simply show it as a two-column table.
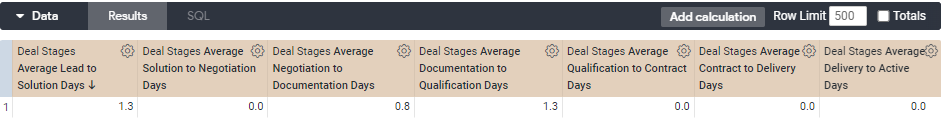
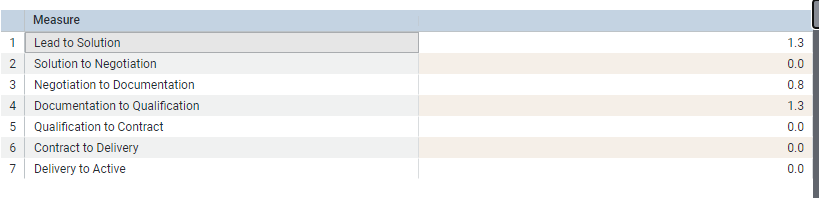
In this example I will use Hubspot Deals data and their average time between some stages. I have only one row of measures like this:
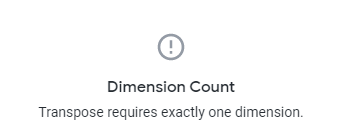
Without a dimension, when using Transpose functionality, Looker will throw an error:
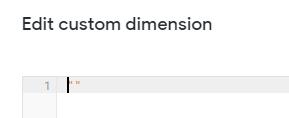
In order to go around it, we can create a Custom Dimension with empty string as a value:
Now, you can click Transpose in the settings of Table visualisation and a two-column table will be created. As you can see, our Custom Dimension is nowhere to be seen.
Last updated